GSA Schedules are used all across America, but we analyzed the largest 100 metro areas and found that a tiny fraction of small businesses take advantage of this opportunity. Fewer than 0.10% of small businesses hold a GSA Schedule Contract.
Almost Zero Small Business GSA Footprint:
Chicago:
Dallas-Fort Worth:
Los Angeles:
New York:
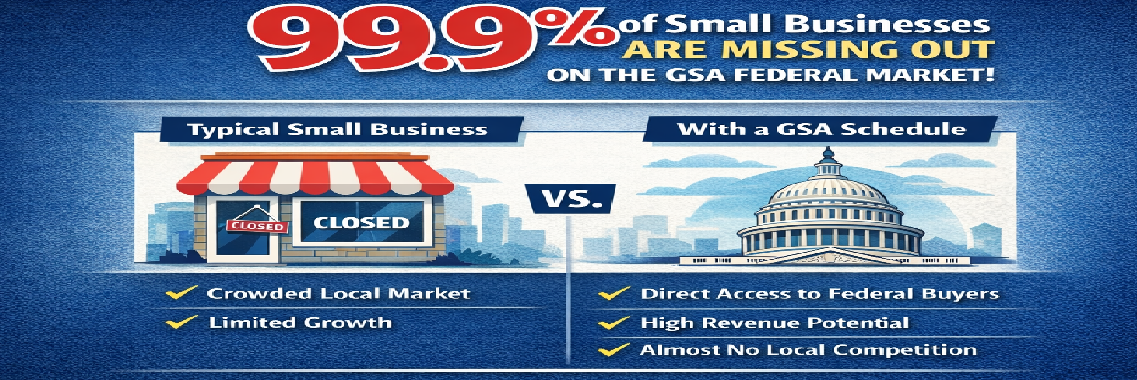
Large rewards for small percentage of Firms that Engage GSA
Across most mid-tier Federal markets average $500,000 to $1.5M per vendor, with low local competition.
Most small businesses believe: “It’s too complicated;” “It takes too long;” “You need federal past performance;” “Only defense contractors win.”
None of that is true. The barrier to entry isn’t capability. It’s understanding the system.
A GSA Schedule gives you:
✔ Direct access to federal buyers
✔ A pre-negotiated contract vehicle
✔ Eligibility for sole-source awards (if certified)
✔ Simplified acquisition process for agencies
✔ A credibility boost in state & local markets
And most importantly: You’re in a marketplace where 99.9% of your local competitors are absent.
There are many metro markets with near-zero participation, Bakersfield 0.00%, Buffalo 0.00%, New Orleans 0.00%, Stockton 0.00%, Toledo 0.00%, Worcester 0.00%
These are wide-open federal sales territories.
The question is: Should you be in a market that your competitors aren’t entering? If 0.1% of small businesses in your city are on GSA… That means the federal government is buying from someone else. Below is the table for the top 100 markets in the US in alphabetical order so you can see how well GSA Contract Holders are doing.
|
Metro Area (MSA) |
Estimated Small Businesses (<500> |
Vendors |
Percentage Small Businesses w/ GSA Schedule |
Average Small Business GSA Sales |
|
Akron, OH |
17,500 |
5 |
0.03% |
420,000 |
|
Albany-Schenectady-Troy, NY |
22,700 |
10 |
0.04% |
241,000 |
|
Albuquerque, NM |
23,100 |
47 |
0.20% |
1,622,872 |
|
Allentown-Bethlehem-Easton, PA-NJ |
22,100 |
7 |
0.03% |
212,143 |
|
Atlanta-Sandy Springs-Roswell, GA |
159,500 |
117 |
0.07% |
988,162 |
|
Augusta-Richmond County, GA-SC |
15,800 |
9 |
0.06% |
221,667 |
|
Austin-Round Rock-San Marcos, TX |
63,500 |
62 |
0.10% |
249,919 |
|
Bakersfield-Delano, CA |
23,000 |
- |
0.00% |
- |
|
Baltimore-Columbia-Towson, MD |
71,100 |
91 |
0.13% |
1,398,901 |
|
Baton Rouge, LA |
22,000 |
20 |
0.09% |
303,750 |
|
Birmingham, AL |
29,700 |
11 |
0.04% |
999,091 |
|
Boise City, ID |
21,000 |
17 |
0.08% |
339,412 |
|
Boston-Cambridge-Newton, MA-NH |
125,000 |
17 |
0.01% |
1,368,529 |
|
Bridgeport-Stamford-Danbury, CT |
24,200 |
8 |
0.03% |
2,880,000 |
|
Buffalo-Cheektowaga, NY |
28,900 |
- |
0.00% |
- |
|
Cape Coral-Fort Myers, FL |
21,400 |
10 |
0.05% |
204,000 |
|
Charleston-North Charleston, SC |
21,600 |
21 |
0.10% |
1,418,095 |
|
Charlotte-Concord-Gastonia, NC-SC |
71,700 |
26 |
0.04% |
293,846 |
|
Chattanooga, TN-GA |
14,600 |
5 |
0.03% |
4,000 |
|
Chicago-Naperville-Elgin, IL-IN |
234,000 |
74 |
0.03% |
546,824 |
|
Cincinnati, OH-KY-IN |
57,300 |
24 |
0.04% |
567,500 |
|
Cleveland, OH |
54,000 |
11 |
0.02% |
899,091 |
|
Colorado Springs, CO |
19,300 |
52 |
0.27% |
2,318,750 |
|
Columbia, SC |
21,700 |
122 |
0.56% |
1,576,434 |
|
Columbus, OH |
55,300 |
36 |
0.07% |
360,694 |
|
Dallas-Fort Worth-Arlington, TX |
207,600 |
41 |
0.02% |
101,220 |
|
Dayton-Kettering-Beavercreek, OH |
20,400 |
27 |
0.13% |
1,428,148 |
|
Deltona-Daytona Beach-Ormond Beach, FL |
18,400 |
- |
0.00% |
- |
|
Denver-Aurora-Centennial, CO |
75,900 |
50 |
0.07% |
292,000 |
|
Des Moines-West Des Moines, IA |
18,700 |
2 |
0.01% |
75,000 |
|
Detroit-Warren-Dearborn, MI |
109,400 |
16 |
0.01% |
382,500 |
|
Durham-Chapel Hill, NC |
15,400 |
16 |
0.10% |
230,938 |
|
El Paso, TX |
21,900 |
22 |
0.10% |
708,182 |
|
Fayetteville-Springdale-Rogers, AR |
15,000 |
25 |
0.17% |
211,400 |
|
Fresno, CA |
29,600 |
10 |
0.03% |
145,500 |
|
Grand Rapids-Wyoming-Kentwood, MI |
29,400 |
16 |
0.05% |
531,875 |
|
Greensboro-High Point, NC |
19,900 |
11 |
0.06% |
257,273 |
|
Greenville-Anderson-Greer, SC |
24,800 |
1 |
0.00% |
1,245,000 |
|
Harrisburg-Carlisle, PA |
15,300 |
10 |
0.07% |
1,477,000 |
|
Hartford-West Hartford-East Hartford, CT |
29,100 |
3 |
0.01% |
385,000 |
|
Houston-Pasadena-The Woodlands, TX |
193,900 |
99 |
0.05% |
554,596 |
|
Indianapolis-Carmel-Greenwood, IN |
54,100 |
46 |
0.09% |
932,609 |
|
Jackson, MS |
15,100 |
- |
0.00% |
- |
|
Jacksonville, FL |
43,800 |
43 |
0.10% |
494,186 |
|
Kansas City, MO-KS |
56,000 |
28 |
0.05% |
720,357 |
|
Kiryas Joel-Poughkeepsie-Newburgh, NY |
17,700 |
1 |
0.01% |
155,000 |
|
Knoxville, TN |
23,800 |
26 |
0.11% |
4,037,885 |
|
Lakeland-Winter Haven, FL |
21,200 |
- |
0.00% |
- |
|
Las Vegas-Henderson-North Las Vegas, NV |
59,700 |
37 |
0.06% |
907,432 |
|
Little Rock-North Little Rock-Conway, AR |
19,100 |
10 |
0.05% |
13,500 |
|
Los Angeles-Long Beach-Anaheim, CA |
321,600 |
50 |
0.02% |
188,800 |
|
Louisville/Jefferson County, KY-IN |
34,700 |
35 |
0.10% |
375,571 |
|
Madison, WI |
17,600 |
31 |
0.18% |
380,484 |
|
McAllen-Edinburg-Mission, TX |
22,800 |
- |
0.00% |
- |
|
Memphis, TN-MS-AR |
33,300 |
14 |
0.04% |
32,857 |
|
Miami-Fort Lauderdale-West Palm Beach, FL |
160,600 |
43 |
0.03% |
2,211,860 |
|
Milwaukee-Waukesha, WI |
39,200 |
21 |
0.05% |
980,000 |
|
Minneapolis-St. Paul-Bloomington, MN-WI |
93,400 |
52 |
0.06% |
390,962 |
|
Nashville-Davidson--Murfreesboro--Franklin, TN |
53,500 |
20 |
0.04% |
2,556,500 |
|
New Haven, CT |
14,300 |
- |
0.00% |
- |
|
New Orleans-Metairie, LA |
24,100 |
- |
0.00% |
- |
|
New York-Newark-Jersey City, NY-NJ |
496,000 |
98 |
0.02% |
785,510 |
|
North Port-Bradenton-Sarasota, FL |
23,300 |
22 |
0.09% |
634,773 |
|
Ogden, UT |
16,600 |
3 |
0.02% |
3,333 |
|
Oklahoma City, OK |
37,200 |
20 |
0.05% |
1,209,750 |
|
Omaha, NE-IA |
24,900 |
10 |
0.04% |
883,500 |
|
Orlando-Kissimmee-Sanford, FL |
73,100 |
49 |
0.07% |
646,429 |
|
Oxnard-Thousand Oaks-Ventura, CA |
20,800 |
- |
0.00% |
- |
|
Palm Bay-Melbourne-Titusville, FL |
16,400 |
23 |
0.14% |
1,154,348 |
|
Philadelphia-Camden-Wilmington, PA-NJ-DE-MD |
157,500 |
58 |
0.04% |
668,017 |
|
Phoenix-Mesa-Chandler, AZ |
129,100 |
81 |
0.06% |
1,285,864 |
|
Pittsburgh, PA |
60,400 |
25 |
0.04% |
714,600 |
|
Portland-Vancouver-Hillsboro, OR-WA |
63,100 |
23 |
0.04% |
467,174 |
|
Providence-Warwick, RI-MA |
42,300 |
4 |
0.01% |
437,500 |
|
Provo-Orem-Lehi, UT |
18,900 |
1 |
0.01% |
415,000 |
|
Raleigh-Cary, NC |
38,900 |
39 |
0.10% |
671,923 |
|
Richmond, VA |
34,100 |
24 |
0.07% |
93,750 |
|
Riverside-San Bernardino-Ontario, CA |
118,000 |
5 |
0.00% |
1,389,000 |
|
Rochester, NY |
26,300 |
14 |
0.05% |
193,214 |
|
Sacramento-Roseville-Folsom, CA |
61,300 |
37 |
0.06% |
1,305,405 |
|
Salt Lake City-Murray, UT |
32,300 |
22 |
0.07% |
279,091 |
|
San Antonio-New Braunfels, TX |
68,800 |
136 |
0.20% |
1,040,882 |
|
San Diego-Chula Vista-Carlsbad, CA |
82,100 |
112 |
0.14% |
1,117,321 |
|
San Francisco-Oakland-Fremont, CA |
115,600 |
51 |
0.04% |
1,101,569 |
|
San Jose-Sunnyvale-Santa Clara, CA |
49,700 |
22 |
0.04% |
218,182 |
|
Seattle-Tacoma-Bellevue, WA |
103,100 |
30 |
0.03% |
614,500 |
|
Spokane-Spokane Valley, WA |
15,000 |
5 |
0.03% |
1,971,000 |
|
St. Louis, MO-IL |
69,900 |
34 |
0.05% |
1,019,118 |
|
Stockton-Lodi, CA |
20,300 |
- |
0.00% |
- |
|
Syracuse, NY |
16,300 |
6 |
0.04% |
420,833 |
|
Tampa-St. Petersburg-Clearwater, FL |
85,200 |
95 |
0.11% |
1,902,368 |
|
Toledo, OH |
14,900 |
- |
0.00% |
- |
|
Tucson, AZ |
26,900 |
25 |
0.09% |
444,800 |
|
Tulsa, OK |
26,400 |
22 |
0.08% |
553,864 |
|
Urban Honolulu, HI |
24,900 |
27 |
0.11% |
1,092,037 |
|
Virginia Beach-Chesapeake-Norfolk, VA-NC |
44,700 |
68 |
0.15% |
2,136,029 |
|
Washington-Arlington-Alexandria, DC-VA-MD-WV |
160,100 |
902 |
0.56% |
1,803,919 |
|
Wichita, KS |
16,400 |
8 |
0.05% |
91,875 |
|
Winston-Salem, NC |
17,500 |
10 |
0.06% |
15,500 |
|
Worcester, MA |
21,900 |
1 |
0.00% |
3,795,000 |